Online Labor Demand up 106,900 in January
Press release from the issuing company
Thursday, January 31st, 2013
- January gain follows a rise of 217,900 in December
- National figure includes a mixture of gains and losses across the States
- NOTE: This year’s annual revision will be released with the February 2013 data on March 6, 2013. The revision will include the introduction of the 2010 SOC occupational codes, several methodology improvements along with update to the seasonal adjustment factors.
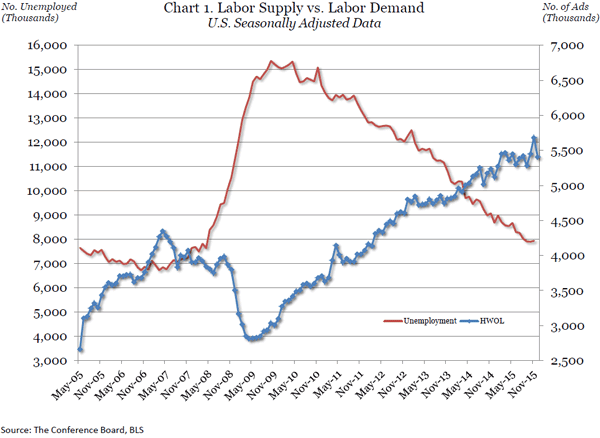
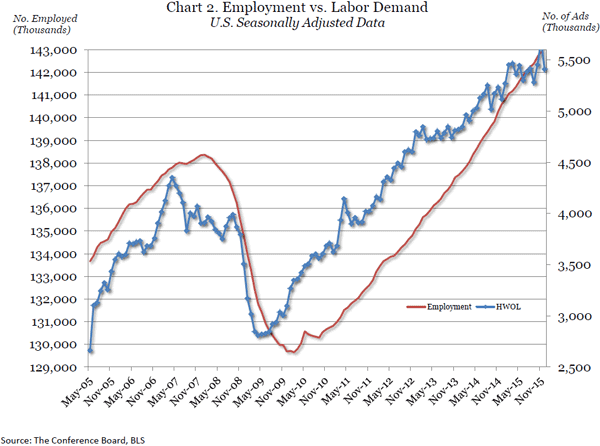
Online advertised vacancies rose 106,900 in January to 5,044,700 according to The Conference Board Help Wanted OnLine (HWOL) Data Series released today. The Supply/Demand rate stands at 2.5 unemployed for every vacancy. In December, there were 7.3 million more unemployed than the number of advertised vacancies, down from 11.8 million at the end of the recession in June 2009.
“January was a mixed bag for labor demand,” said June Shelp, Vice President at The Conference Board, “with gains in some States offsetting losses in others.” About two thirds of the States posted gains while one third of the States were down, and about half of the 22 major occupational groups were up in January. Winning occupations included Food Preparation and Serving along with Transportation and Material Moving while traditional office occupations — Business and Finance, Computer and Math, and Office and Administrative Support — declined. (See Occupational detail on page 6.)


REGIONAL AND STATE HIGHLIGHTS
- All regions but the West increased in January with the largest gain (22,700) in the South
- Twelve of the 20 largest States posted modest January increases while others declined or remained unchanged
January Changes for States
In January, online labor demand rose in 32 of the 50 States in the U.S. (Table 3). All States except Vermont were above last January’s levels.
In the South, online labor demand rose 22,700 in January (Table A) with Virginia posting the largest increase, 5,100. Georgia was next with a January gain of 4,300 while North Carolina rose 3,600. States with declines in January included: Maryland, down 5,400; Florida, down 4,500; and Texas, down 400. Among the smaller States, South Carolina increased by 3,100 and Arkansas increased by 1,900 while Louisiana lost 1,200 and Tennessee dropped 700.
Online labor demand in the Midwest rose 9,800 in January. Illinois experienced the largest increase, 9,600. Ohio rose 5,400, and Missouri gained 200. Wisconsin remained constant at a series high of 108,700. Michigan dropped 10,300. Minnesota decreased by 2,800. Among the smaller Midwest States in January, Kansas gained 3,000, Indiana rose 1,800, and North Dakota gained 400.
Online labor demand in the Northeast rose 4,100 in January with Pennsylvania up 3,800 and New York up 1,400. Other States posting modest increases included New Jersey, up 900, and Massachusetts, up 400. Among the smaller States in the Northeast, January labor demand increased by 2,500 in Connecticut, 500 in New Hampshire, 200 in Rhode Island, and 100 in Maine (Table 3).
Online labor demand in the West decreased by 4,700 in January. Western States that increased included California, the region’s largest State, up 10,000, and Arizona, up 1,800. Large States posting declines included Colorado, down 1,300, and Washington, down 1,200. Among the smaller States in January, Utah fell 1,700, Oregon lost 300, and Nevada fell 200 (Table 3).
The Supply/Demand rates for the States are for December 2012, the latest month available for state unemployment data. The number of advertised vacancies exceeded the number of unemployed only in North Dakota and Nebraska, where the Supply/Demand rates were 0.63 and 0.96 respectively. The State with the highest Supply/Demand rate is Mississippi (4.58), where there were close to five unemployed workers for every online advertised vacancy. Note that the Supply/Demand rate only provides a measure of relative tightness of the individual State labor markets and does not suggest that the occupations of the unemployed directly align with the occupations of the advertised vacancies.
METRO AREA HIGHLIGHTS
- In January, 30 percent of the 52 largest metro areas posted increases in labor demand with 70 percent unchanged or declining
- Half of the largest metro areas have supply/demand rates below 2, indicating that there are fewer than two unemployed workers for every online advertised vacancy
Metro Area Changes
In January, 14 of the 20 largest MSAs and 36 of the 52 metropolitan areas for which data are reported separately posted decreases in the number of advertised vacancies (Table B and Table 5). In the largest metro areas in January, New York in the Northeast posted a gain of 7,500 advertised vacancies. Other large metro areas posting January gains included: Boston, up 1,100, in the Northeast; Chicago in the Midwest, up 7,300; Atlanta, up 2,500, and Houston, up modestly by 500, in the South. In the West, Phoenix was up slightly by 400 while the other large metro areas posted modest declines (Table B).
Twenty-one of the reported MSAs had Supply/Demand rates in November 2012 (the latest available data for unemployment) lower than 2, indicating there are fewer than two unemployed for every advertised vacancy (See Table 6). Washington, DC continues to have the most favorable Supply/Demand rate (1.04) with about one advertised vacancy for every unemployed worker. Salt Lake City (1.20), Oklahoma City (1.21), Minneapolis-St. Paul (1.23), Boston (1.38), Columbus (1.38), Honolulu (1.39), and San Jose (1.40) had the next lowest Supply/Demand rates.
Metro areas in which the number of unemployed is substantially above the number of online advertised vacancies include Riverside, CA with nearly seven unemployed workers for every advertised vacancy (6.86), Sacramento (3.79), Las Vegas (3.56), and Los Angeles (3.36). Supply/Demand rate data are for November 2012, the latest month for which unemployment data for local areas are available (Table B & Table 6).
In the 3.5 years since the end of the recession, a number of the large metro areas have posted gains in labor demand above 100 percent. Metro areas with these gains include: San Jose (up 136 percent), Denver (up 135 percent), Cleveland (up 135 percent), Milwaukee (up 131 percent), Nashville (up 130 percent), Minneapolis-St. Paul (up 128 percent), Detroit (up 126 percent), Columbus (up 121 percent), Charlotte (up 121 percent), Birmingham (up 120 percent), San Francisco (up 114 percent), Atlanta (up 111 percent), Louisville (up 110 percent), Indianapolis (up 110 percent), Portland (up 107 percent), Oklahoma City (up 106 percent), and Dallas (up 104 percent).
OCCUPATIONAL HIGHLIGHTS
In January:
- 10 of the 22 major occupational groups in the Standard Occupational Classifications (SOC) rose in January (Table C and Table 7)
- Food Preparation and Serving-Related occupations were up 55,600 while Healthcare Practitioners and Technical occupations and Business and Financial Operations occupations posted declines of 25,900 and 15,200 respectively
Occupational Changes for the Month of January
In January, among the largest occupational groups, Food Preparation and Serving-Relatedoccupations posted an increase of 55,600 to 270,700 largely due to higher demand for First-Line Supervisors / Managers of Food Preparation and Serving Workers and Combined Food Preparation and Serving Workers including Fast Food. Labor demand for Transportation and Material Moving was up 11,400 to 278,300 due to increased demand for Driver / Sales Workers.
Healthcare Practitioners and Technical occupations fell 25,900 to 616,300 and were led by a decrease in demand for Registered Nurses, Physical Therapists, Pharmacy Technicians, Occupational Therapists, Speech Pathologists, and Family and General Practitioners.Business and Financial Operations occupations fell 15,200 to 283,800. In the Business and Financial category, the January decrease included lower demand for Accountants, Management Analysts, Auditors, and Loan Officers. Demand for Office and Administrative Support occupations dropped 10,800 to 505,000 due to decreased demand for Customer Service Representatives, General Office Clerks, Executive Secretaries and Administrative Assistants, First-Line Supervisors / Managers of Office and Administrative Support Workers, and Bookkeeping, Accounting, and Auditing Clerks (Table C).


