U.S. Southeast Unfortunate Standout in Food Stamps
Wednesday, June 26th, 2013
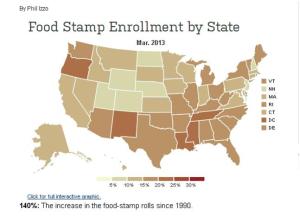
Phil Izzo of Wall Street Journal’s Real Time Economics posted a comprehensive map of food stamp enrollment of all 50 states and D.C. since 1990. What we have seen is a dramatic rise that can be attributed to changing requirements of a new economy and a steep recession of 2008-2009. Food stamp enrollment has more than doubled since 1990 with a 140 percent increase.
If we were to evaluate the U.S. in eight regions, Southwest, Far West, Plains, Great Lakes, Southeast, Rocky Mountain, Mideast, and New England, the Southeast has the greatest proportion of its population that are on food stamps. When looking at the U.S. average of 15 percent of citizens being on food stamps, the Southwest also stood out in ways not desired. Here’s the overall rankings by region (most to least):
- Southeast – 18.7 percent
- Southwest – 17.3 percent
- Great Lakes – 15.8 percent
- Far West – 15.3 percent
- Mideast – 15.2 percent
- New England – 14.7 percent
- Plains – 11.7 percent
- Rocky Mountain – 10.6 percent
Note: Regional calculations were based on data collected by the U.S. Bureau of Economic Statistics and Wall Street Journal’s Real Time Economics.
From reviewing this regional ranking, there are a few market forces at play.
The Southeast was hampered by a collapse of real estate markets and financial systems, which greatly impacted Florida, Georgia, and North Carolina. They are also facing a competitive disadvantage when it comes to educational attainment and innovation capacity. As a result, they were the only region where every state showed state had populations where food stamp enrollment exceeded the U.S. national average of 15%. Although, it should be pointed out that their lower cost of living make it easier for people to qualify, so this can be a misleading indicator when comparing other regions.
When comparing the Southwest and Far West regions, the Southwest was worse. With the exception of Texas which was equal to the U.S. average of 15 percent, every other state exceeded the national average. As for the Far West, California was below the national average with only an 11 percent on food stamps, but that’s deceptive. California has a very high cost of living, so the income requirement for obtaining food stamps is harder to attain there. Even though California has seen a boost in economic growth that can be mostly attributed to its highly profitably high-technology sector, they have been plagued with high unemployment and a consumer-friendly climate that scares industry.
The Rocky Mountain and Plains region were relatively unscathed by the real estate collapse, so that can partially explain its relatively low enrollment in food stamps. With the exception of Missouri where 16 percent of its population was on food stamps which was slightly higher than the U.S. average, every other state within these two regions were below the U.S. average. Most of these states have low populations and have less economic diversity than other regions. While one might infer that would result in more poverty, it actually can contribute to more equality, since there is less distinction in job skill sets in these states for businesses to choose from. Therefore, there is less pay disparities in these regions.
In summary, the Great Recession resulted in many middle-class families losing a stable income and having to resort to applying for food stamps. They have still not been able to regain their previous standard of living. That is because technology has made it harder to attract relatively low skilled, good paying jobs.


