
SBA Current Entrepreneurship Statistics and Trends Surprising
Monday, March 11th, 2013
The Business Administration recently released the 2012 Small Business Economy, its statistical report on small business. Because the report provides the latest available data on several key small business statistics, its publication provides me with an opportunity to update five charts that I have published at various times in various places, including Small Business Trends.
Employer Firms Continue to Shrink as a Fraction of all Businesses
As the figure below shows, businesses with employees comprised only 20.6 percent of all U.S. companies in 2010, down from 26.4 percent in 1997.
 Source: Created from data from the 2012 Small Business Economy
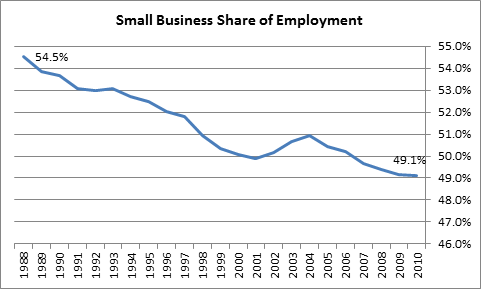
Small Business’s Share of Private Sector Employment Continues to Decline
As the figure below shows, small business employed a minority – 49.1 percent – of private sector workers in 2010, down significantly from the 54.5 percent it employed in 1997.
 Source: Created from data from the 2012 Small Business Economy
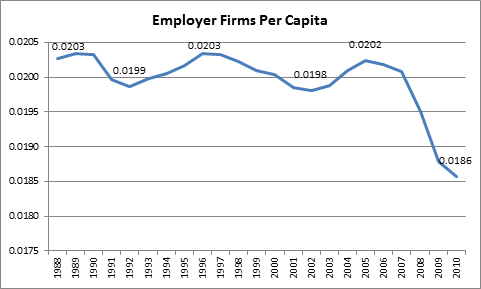
The Number of Employer Firms Per Capita Continues to Decline
As the figure below shows, the number of employers per member of the population continued to fall in 2010, continuing a decline that began in 2005, before the start of the Great Recession. Between 1988 and 2005, the number of employer firms per capita fluctuated between 1.98 and 2.23 firms per thousand people.
 Source: Created from data from the 2012 Small Business Economy
Employer Firm Formation has Stabilized, Though at Below Pre-recession Levels
As the figure below shows, the number of new employer firms founded per thousand people edged up from 1.70 to 1.73 in 2010, after having declined significantly from 2006 through 2009.
 Source: Created from data from the 2012 Small Business Economy
Self-employment Rates Continue to Fall
As the figure below shows, the combined incorporated and unincorporated self-employment rate declined from 10.3 percent of the civilian labor force in 2000 to 9.5 percent in 2012. While the incorporated self-employment rate was higher in 2012 than in 2000, its rise did not offset the decline in the unincorporated self-employment rate.
The latter had been trending downward since the mid-1990s, after remaining largely flat between the early 1970s and mid-1990s.
 Source: Created from Bureau of Labor Statistics data.

